Trade the levels
dealers defend.
Options dealers hedge billions in gamma every session — and their hedging creates support and resistance you can see. THEGEXLAB maps live dealer positioning onto ES, NQ and GC futures: call walls, put walls, zero gamma, and the regime that tells you whether the market is pinned or primed to run.
SPY → ESSPX → ESQQQ → NQGLD → GC
0DTE & 1DTE
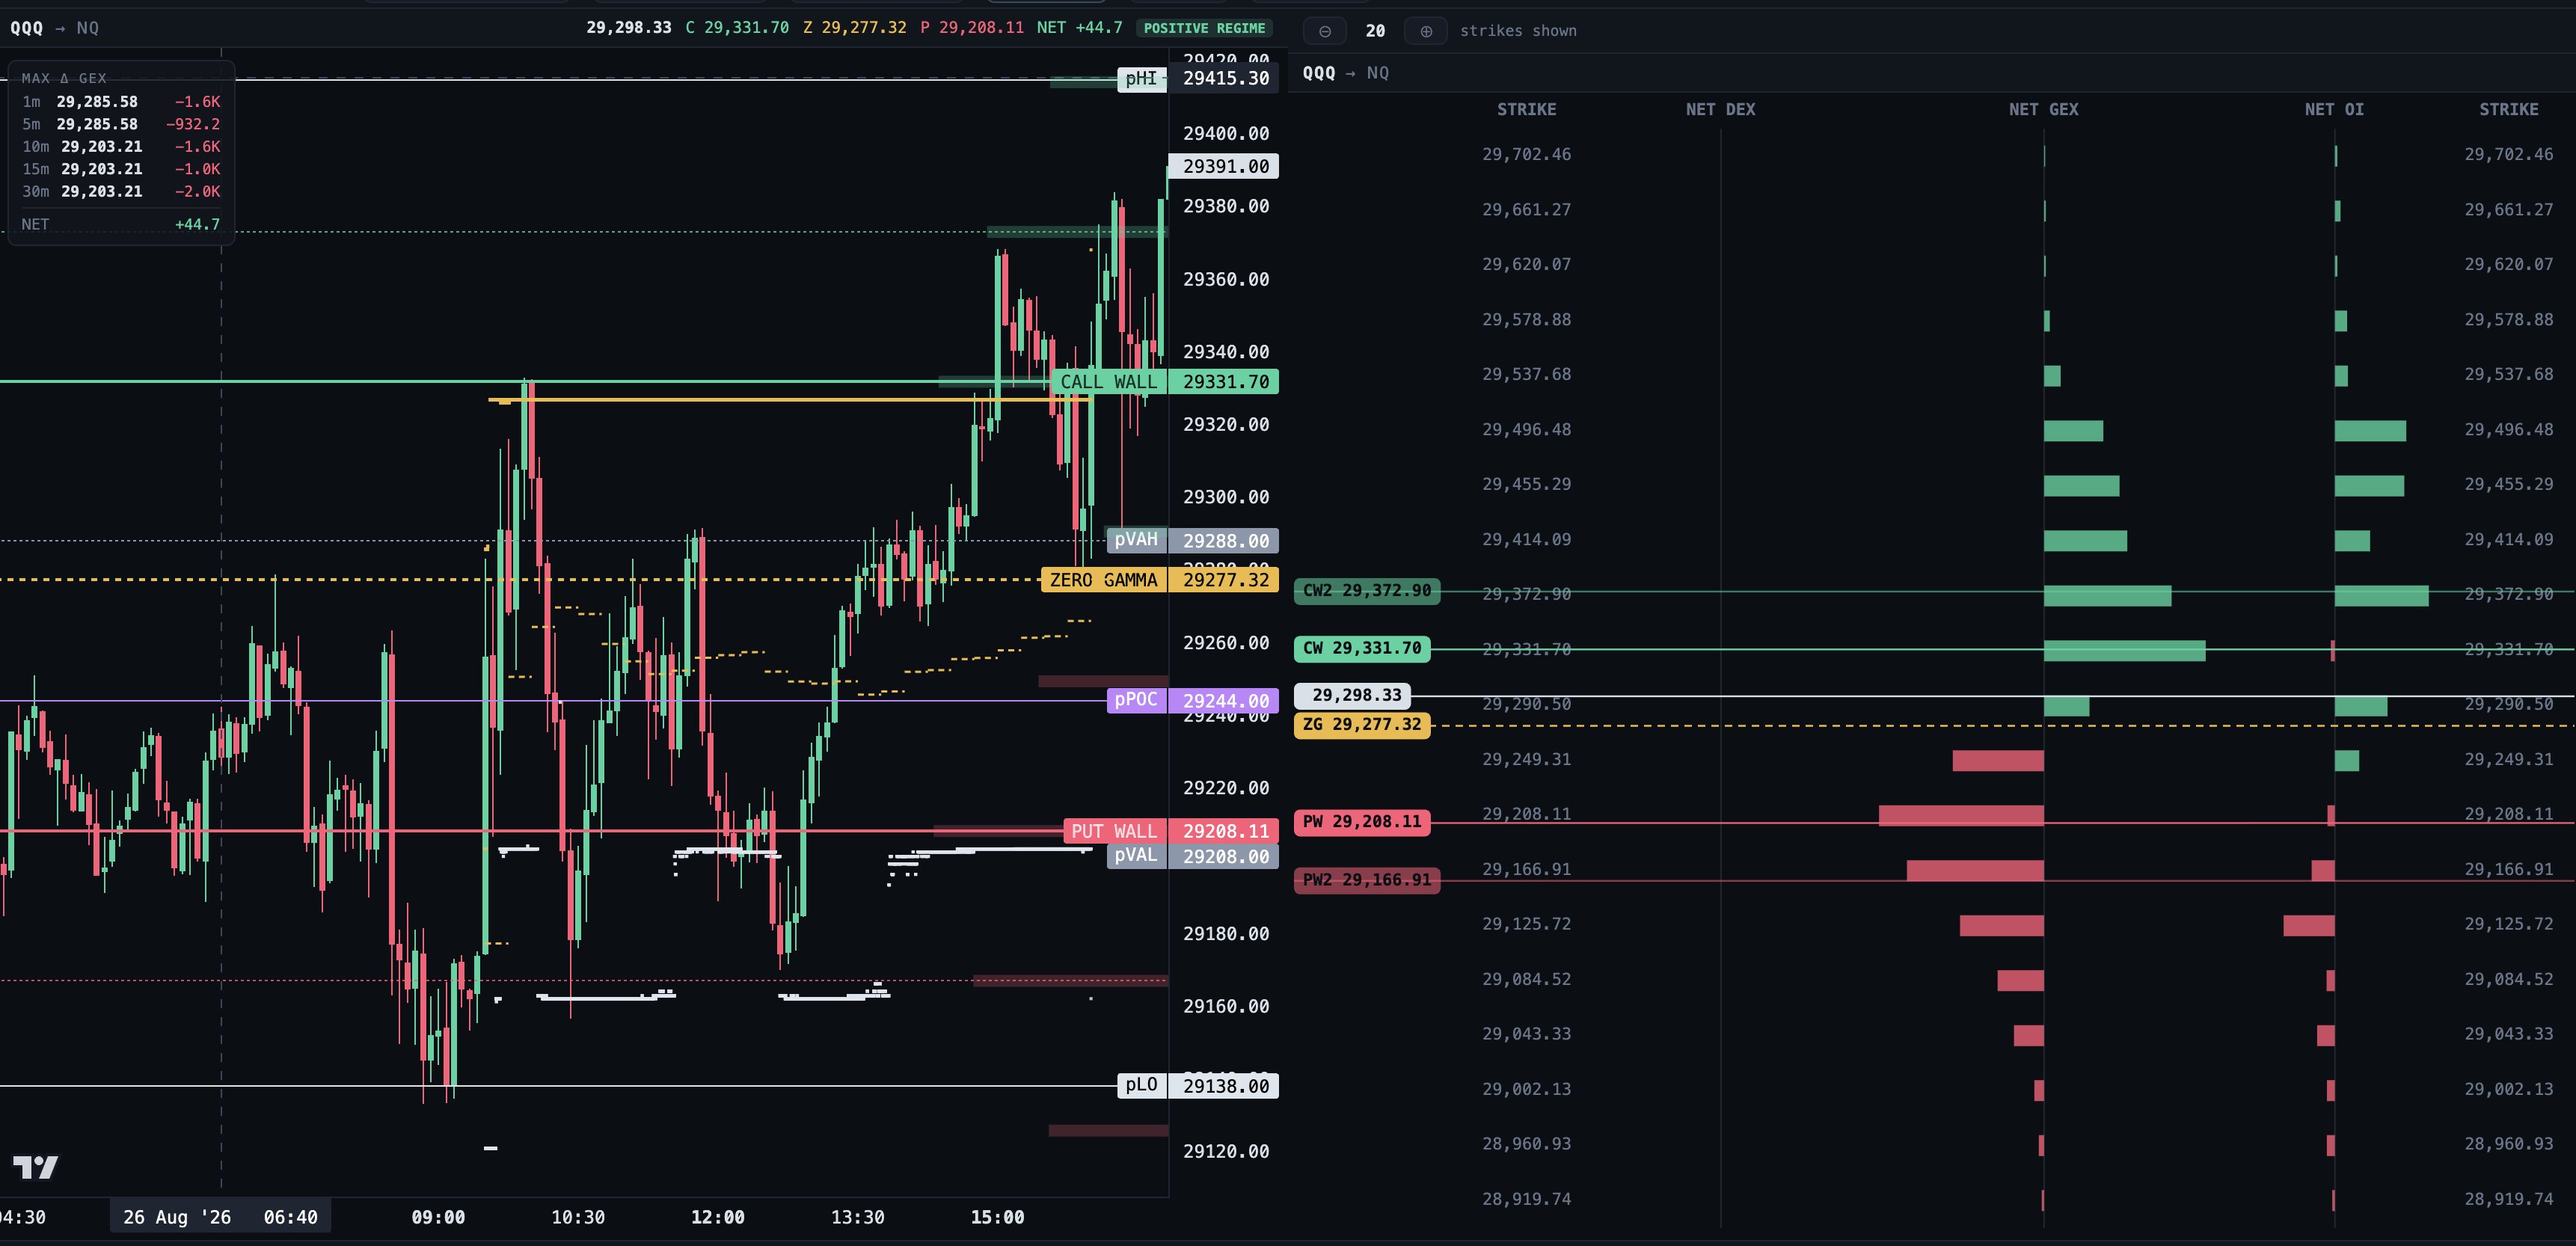 Live regime badgePositive or negative gamma regime at a glance — with divergence warnings when price and positioning disagree.
Wall migrationHow the dominant strikes have moved over the last 1–30 minutes, so you see rotation before it prints.
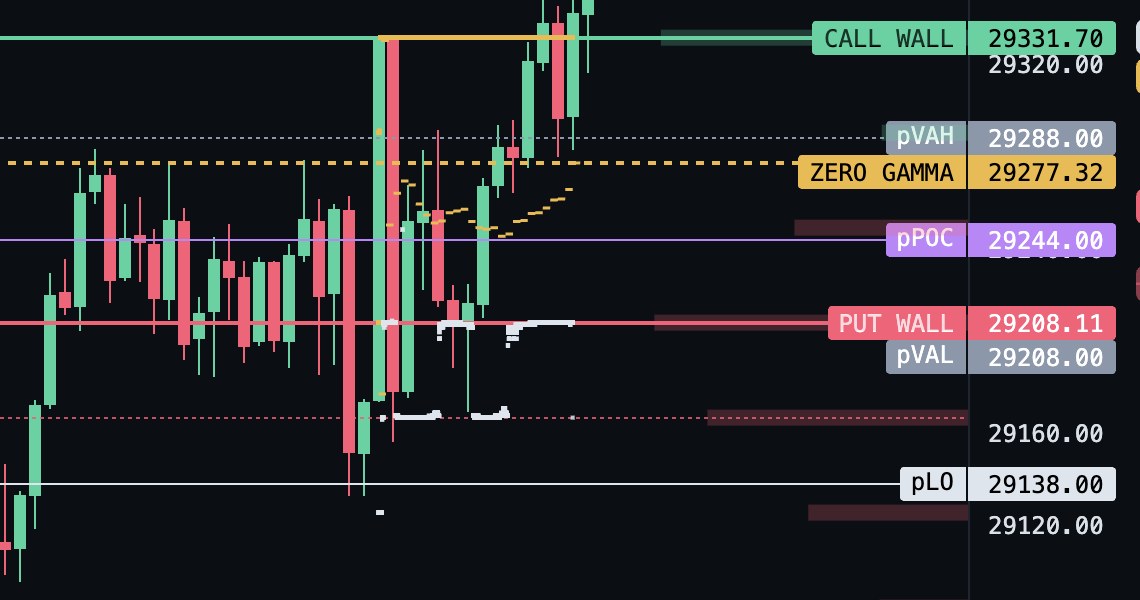
Call wallThe heaviest positive-gamma strike, converted to NQ. Dealer hedging leans against price here — resistance and pin risk.
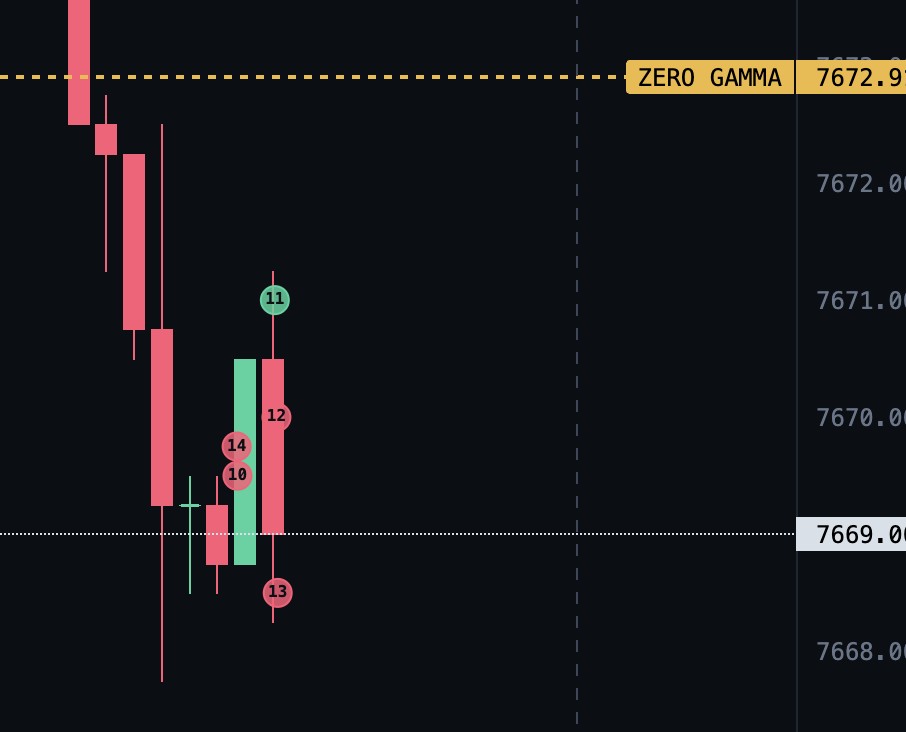
Zero gammaThe flip line. Above it, hedging dampens moves; below it, hedging accelerates them.
Market-generated levelsPrior-day value area, POC, RTH high/low and overnight range — drawn automatically every session.
Put wallThe heaviest negative-gamma strike — the downside level dealers defend.
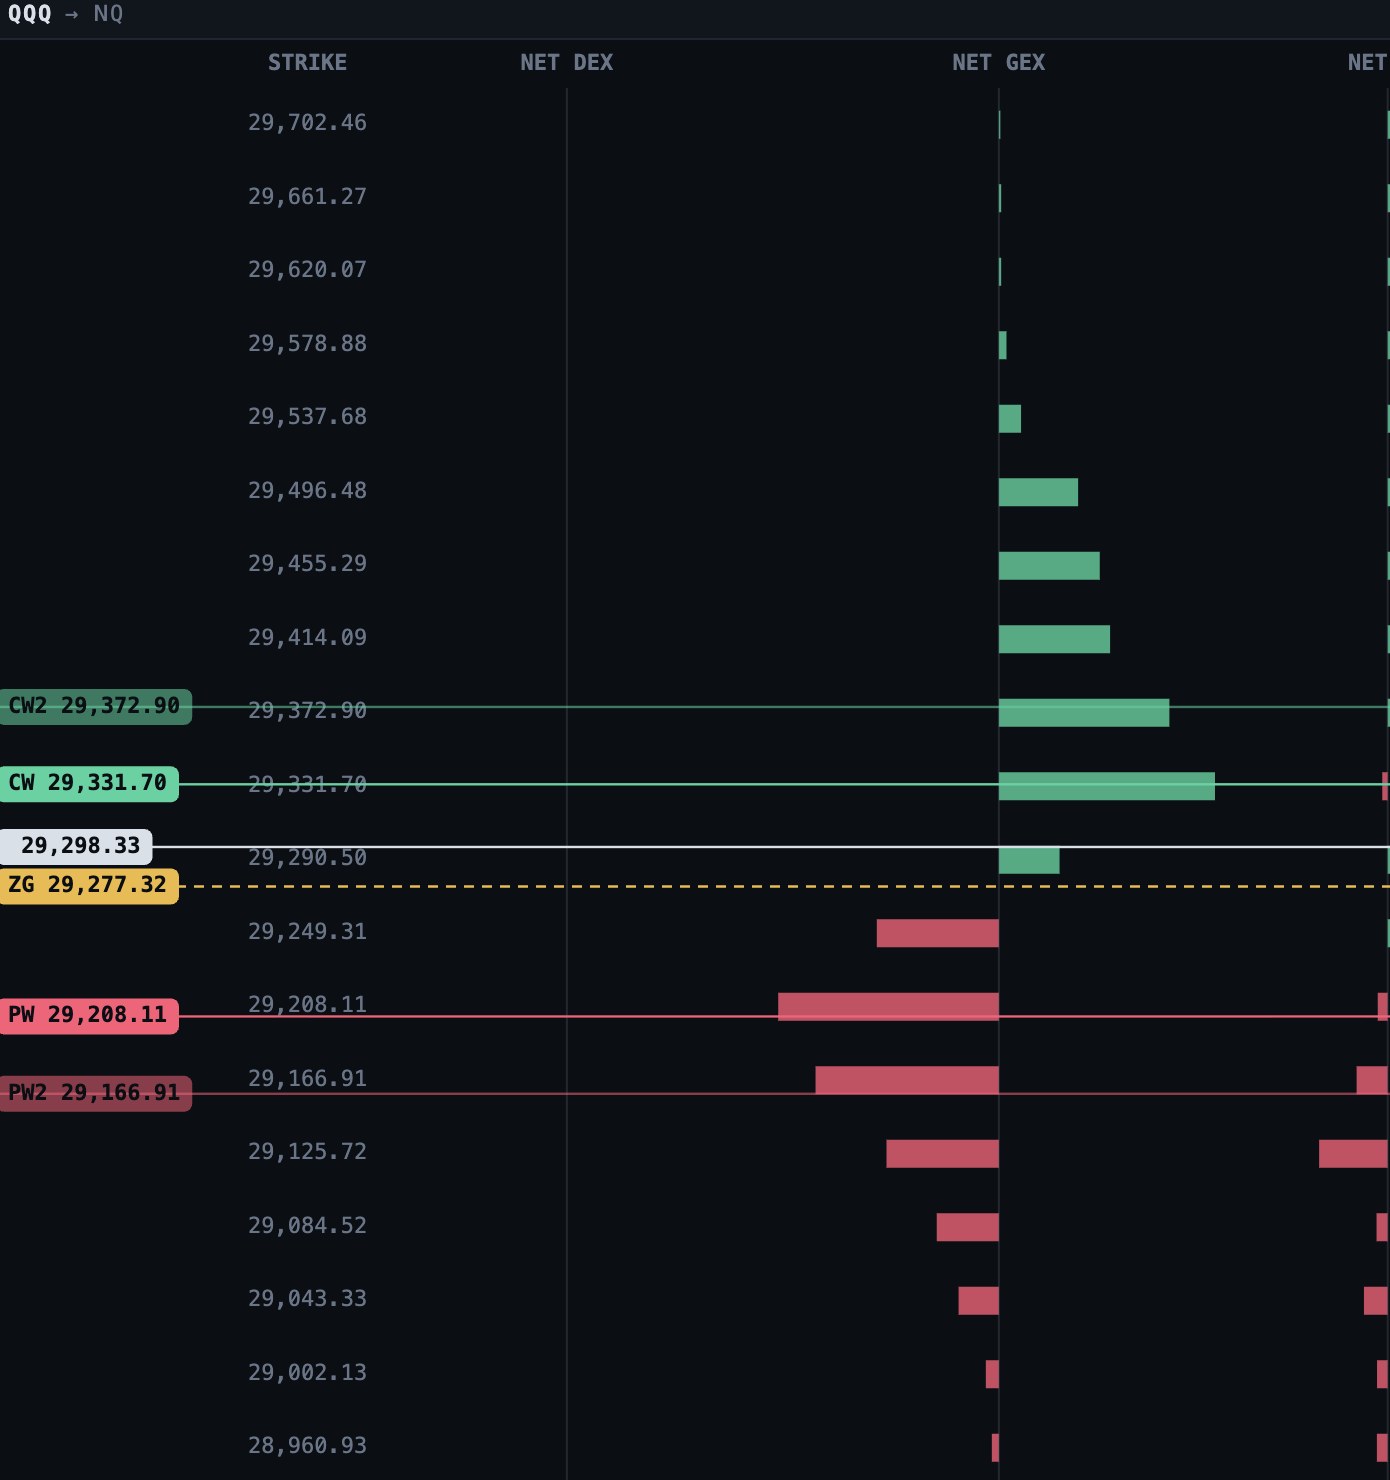
Strike profileNET DEX, NET GEX and NET OI ladder per strike — see exactly where positioning stacks up, live.
Live regime badgePositive or negative gamma regime at a glance — with divergence warnings when price and positioning disagree.
Wall migrationHow the dominant strikes have moved over the last 1–30 minutes, so you see rotation before it prints.
Call wallThe heaviest positive-gamma strike, converted to NQ. Dealer hedging leans against price here — resistance and pin risk.
Zero gammaThe flip line. Above it, hedging dampens moves; below it, hedging accelerates them.
Market-generated levelsPrior-day value area, POC, RTH high/low and overnight range — drawn automatically every session.
Put wallThe heaviest negative-gamma strike — the downside level dealers defend.
Strike profileNET DEX, NET GEX and NET OI ladder per strike — see exactly where positioning stacks up, live.